Driving Mechanisms of Digital Transformation in Manufacturing Suppliers: A Moderated Mediation Model
DOI:https://doi-001.org/1025/17793721529938
Mengzhuo Song
School of Management, Shandong University,Jinan 250100, China
Email: 15169833985@163.com
Abstract: In the context of Industry 5.0 and China’s “Dual Carbon” targets, the manufacturing industry—as a core carbon-emitting sector—has garnered significant attention. Upstream suppliers often face multiple practical challenges during digital transformation, including technological, resource-related, and collaborative constraints. Whether manufacturers’ sustainable development performance can serve as a critical external driving force to effectively promote the digital transformation process of upstream suppliers remains an important question that existing research has yet to systematically address. This study uses Chinese A-share listed manufacturing companies and their suppliers from 2013-2022 (manufacturers) and 2014-2023 (suppliers) as research samples, constructing a “manufacturer-supplier-year” panel dataset. Employing a moderated mediation model combined with multiple empirical methods—including baseline regression, robustness tests, and heterogeneity analysis—this study systematically investigates the influence mechanisms and boundary conditions between these entities. The findings reveal: (1) Manufacturers’ sustainable development performance significantly and positively drives suppliers’ digital transformation. This conclusion remains robust after multiple validity tests; (2) Supplier green innovation plays a fully mediating role between manufacturers’ sustainable development performance and suppliers’ digital transformation; (3) Manufacturer reputation positively moderates the relationship between supplier green innovation and digital transformation; (4) Supplier executives’ innovation consciousness positively moderates the relationship between manufacturers’ sustainable development performance and supplier green innovation; (5) Supplier executives’ green cognition positively moderates the relationship between supplier green innovation and digital transformation. These findings provide theoretical support and practical guidance for supply chain collaborative transformation.
Keywords: Sustainable Development Performance; Digital Transformation; Green Innovation; Corporate Reputation; Executive Green Cognition; Executive Innovation Consciousness
1. Introduction
Against the backdrop of deep integration between the global digitalization wave and Sustainable Development Goals (SDGs), the United Nations Industrial Development Organization (UNIDO) actively promotes digital transformation processes within the context of the Fourth Industrial Revolution. Meanwhile, the UN 2030 Agenda for Sustainable Development explicitly advocates for nations to build green, inclusive, and sustainable industrial systems, promoting the digital and green development of manufacturing. China’s successive introduction of policies such as “Made in China 2025” and the “Implementation Plan for Carbon Peaking in the Industrial Sector” has further established a development pathway of “coordinated promotion of digitalization and greenization.” Digital transformation and sustainable development in manufacturing have become key drivers for industrial upgrading and achieving high-quality development. For the manufacturing industry, whether manufacturers or suppliers, digital transformation is a critical lever for enhancing production efficiency, while green sustainability is the necessary path for long-term development. Together, these elements constitute the dual foundation for high-quality development in manufacturing (Ghobakhloo et al., 2024).
Corporate Sustainability Performance (CSP) reflects a firm’s fulfillment of the Triple Bottom Line (TBL)—namely economic, environmental, and social performance (Steblianskaia et al., 2023). Emphasizing sustainable development performance, i.e., adopting TBL, can help firms better pursue long-term development (Chang et al., 2017). Existing research on CSP, from an internal perspective, focuses on corporate governance factors (such as board independence, gender diversity on boards, audit independence) (Li et al., 2024), external environment and policies (Ahmad et al., 2021), corporate culture and internal capabilities (Li et al., 2022; Le, 2025). From an external perspective, research examines the influence of stakeholder pressures, market competition, and industry characteristics on CSP (Florez-Jimenez et al., 2025). However, existing studies predominantly focus on individual enterprises, with limited attention to cross-enterprise, especially supply chain-level, sustainability performance impacts.
At the mechanism research level, supplier green innovation serves as a key link connecting green development with digital transformation. It not only responds to manufacturers’ sustainability requirements but also lays the foundation for digital transformation through technology accumulation and resource integration, thus demonstrating significant mediating transmission effects. However, existing research typically treats supplier green innovation as either an independent or dependent variable, such as examining the driving effect of corporate digital transformation on green innovation (Oliveira et al., 2024), failing to reveal its mediating transmission value between manufacturers’ sustainable development performance and suppliers’ digital transformation. Meanwhile, in practice, manufacturer reputation, as an important intangible asset in supply chain cooperation, directly affects suppliers’ cooperative trust and resource investment willingness (Kim and Kim, 2024); supplier executives’ innovation consciousness and green cognition, as core influencing factors of strategic decision-making, determine enterprises’ ability to interpret and respond to external pressures. These boundary conditions warrant in-depth exploration.
In light of this, this study takes Chinese A-share listed manufacturing companies and their corresponding suppliers as research objects, empirically testing the driving effect and underlying mechanisms of manufacturers’ sustainable development performance on their suppliers’ digital transformation. The core research contents include: verifying the main effect of manufacturers’ sustainable development performance on suppliers’ digital transformation; identifying the mediating role of supplier green innovation; examining the effects of three types of moderating variables and the moderated mediation effects; and conducting heterogeneity analysis based on enterprise nature, scale, and supply chain position. The marginal contributions of this study are mainly reflected in three aspects: First, breaking through the limitations of single-enterprise research perspectives, this study systematically confirms the positive driving effect of manufacturers’ sustainable development performance on suppliers’ digital transformation from a cross-entity supply chain perspective, enriching cross-entity impact research in related fields. Second, this study not only clarifies the full mediating role of supplier green innovation but also elucidates the path through which manufacturers’ sustainable development performance promotes suppliers’ digital transformation, providing a theoretical basis for supply chain collaborative transformation. Third, this study reveals the moderating roles of manufacturer reputation, supplier executives’ innovation consciousness, and green cognition, identifying key boundary conditions for the influence mechanism.
The remainder of this paper is organized as follows: Chapter 2 systematically reviews relevant literature and proposes research hypotheses based on foundational theories such as resource theory and upper echelons theory, constructing the theoretical model. Chapter 3 details the research design, including sample selection criteria, data sources, and variable definitions. Chapter 4 presents empirical test results, sequentially conducting main effect tests, robustness analysis, mediation effect tests, moderation effect tests, and moderated mediation effect tests. Chapter 5 conducts heterogeneity analysis from three dimensions: supplier enterprise nature, scale, and supply chain position. Chapter 6 summarizes research conclusions, proposes management implications, and discusses future research directions.
2. Theoretical Analysis and Research Hypotheses
2.1 Manufacturers’ Sustainable Development Performance and Suppliers’ Digital Transformation
Sustainable development strategy focuses on the balance among society, economy, and environment. Existing research has increasingly focused on corporate sustainable development performance, a characteristic that is also prominent in the Chinese market. With the enhancement of social responsibility awareness, manufacturers not only pay more attention to their own sustainable development performance but also actively transmit pressure to suppliers through methods such as carbon footprint tracking, prompting suppliers to undergo digital transformation to meet manufacturers’ sustainability requirements. In existing research, discussions on sustainable development performance and digital transformation in the manufacturing industry mostly focus on single manufacturing entities, i.e., exploring the mutual influence between enterprises’ own sustainable development performance and their own digital transformation. For example, existing research indicates that enterprises’ application of digital technology increases the costs of environmentally unfriendly behaviors, thereby promoting enterprises to value sustainable development and environmental performance (Wang and Wang, 2021). However, such research does not involve cross-entity impacts between upstream and downstream supply chain entities, nor does it reveal the transmission mechanism of sustainable development requirements from manufacturers to suppliers.
From the stakeholder theory perspective, enterprise stakeholders are divided into internal stakeholders and external stakeholders (Clarkson, 1995). The former includes shareholders, employees, and managers; the latter includes regulators, government departments, customer enterprises, media, and local communities, among which customer enterprises’ demands and pressures have direct driving effects on enterprise strategic adjustments (Sharma et al., 2025). As the core customers of suppliers, manufacturers are key stakeholders of suppliers. When manufacturers themselves increasingly value and implement sustainable development strategies, their requirements for the sustainability of products and services provided by suppliers correspondingly increase. Suppliers will clearly perceive pressure from manufacturers. This pressure prompts suppliers to make the response of undergoing digital transformation to better meet manufacturers’ increasingly elevated standards and requirements in sustainability.
From the supply chain spillover effect perspective, the improvement of manufacturers’ sustainable development performance can also empower suppliers’ digital transformation through two pathways: knowledge spillover and financial spillover. In terms of knowledge spillover, knowledge elements invested in enterprise innovation processes have non-exclusivity characteristics; they form enterprise-specific innovation outputs and also diffuse to supply chain partners through channels such as technical exchanges and cooperative R&D (Arrow, 1972). Knowledge resources such as green technology and process optimization experience accumulated by manufacturers in pursuing sustainable development are transmitted to suppliers through supply chain cooperation networks, providing a technical foundation for suppliers’ digital transformation. In terms of financial spillover, enterprises generate financial support effects for upstream and downstream enterprises in the supply chain (Kutsuna et al., 2016). Manufacturers’ good performance in sustainable development is usually positively correlated with their environmental responsibility and financial soundness. This comprehensive advantage transforms into financial support for suppliers through mechanisms such as extended payment terms and supply chain financing, providing capital guarantees for suppliers’ digital transformation.
Furthermore, the improvement of manufacturers’ sustainable development performance can promote the construction of supply chain trust mechanisms. Cooperation based on sustainable development concepts implies that both parties need to establish common environmental, social, and governance standards. This shared framework can regulate both parties’ production behaviors and promote their information transparency, thereby effectively reducing information asymmetry and reducing cooperation risks caused by compliance or reputation issues, ultimately promoting deep cooperation between parties in production coordination, information sharing, and joint investment (Kinney and Wempe, 2002). This stable cooperative relationship can reduce suppliers’ concerns about uncertainty in digital transformation and promote suppliers to undergo digital transformation.
In summary, manufacturers’ sustainable development performance, on one hand, transmits external pressure to suppliers through its identity as a key customer of suppliers, forcing them to initiate digital transformation to meet cooperation requirements; on the other hand, it provides technical and financial support for suppliers’ digital transformation through dual knowledge and financial spillover effects; meanwhile, it can promote the construction of supply chain trust mechanisms, reducing transformation uncertainty and thereby promoting supplier transformation. On this basis, this study proposes Hypothesis 1:
H1: Manufacturers’ sustainable development performance positively affects suppliers’ digital transformation.
2.2 The Mediating Role of Supplier Green Innovation
As a key pathway for promoting sustainable supply chain development, green innovation has become a common agenda for global manufacturing transformation. Against this practical background, green innovation has received increasing attention in management and economics research. According to “Innovation Diffusion Theory” (Rogers, 1962), green innovation is not merely a technological advancement but a comprehensive reshaping of internal management models and external market environments for enterprises. As a global manufacturing powerhouse, China’s practices and explorations in green innovation not only possess local significance but also provide significant reference value for global industrial green transformation.
First, manufacturers’ sustainable development performance creates a dual impact on supplier green innovation. On one hand, manufacturers’ high sustainable development performance requirements create significant legitimacy pressure on suppliers (Huang et al., 2023). If unable to meet hard requirements such as environmental protection and low carbon, suppliers face the realistic risk of losing orders or even being excluded from core supply chains. On the other hand, manufacturers do not merely apply pressure; to pursue good sustainable development performance, manufacturers often actively engage in technological innovation, enabling them to provide clear and feasible “technical guidance” for suppliers’ green transformation through their own technological innovation. This is concretely manifested in manufacturers actively sharing environmental technology knowledge, providing green process standards, and even jointly investing in collaborative R&D, thereby significantly reducing suppliers’ trial-and-error costs and technical barriers to green innovation, making their transformation path traceable. Supplier green innovation activities can accumulate digital capabilities and technical resources for subsequent digital transformation.
In summary, manufacturers’ sustainable development performance can promote supplier green innovation through pressure transmission and technical guidance. Supplier green innovation, in turn, accumulates technical foundation and resource conditions for digital transformation, thereby playing a mediating role. Based on this, this study proposes Hypothesis 2:
H2: Supplier green innovation plays a mediating role between manufacturers’ sustainable development performance and suppliers’ digital transformation.
2.3 The Moderating Role of Manufacturer Reputation
Corporate reputation is a comprehensive evaluation formed by stakeholders based on enterprise behavioral performance; it is an intangible resource accumulated by enterprises, with its core being the transmission of enterprise reliability, compliance, and cooperative value (Fombrun and Shanley, 1990). With the widespread recognition of sustainable development concepts, manufacturing industries face increasing sustainable development pressure due to their high energy consumption and high pollution characteristics. According to public pressure theory, supplier enterprise behavior is influenced by supply chain partners (Y. Zhang and Yang, 2021). Manufacturer reputation, as an important external influencing factor, will have significant impact on supplier enterprise behavior. Specifically, when manufacturers gain more external attention and form higher corporate reputation, this higher corporate reputation can prompt manufacturers to strengthen their requirements and expectations for suppliers in sustainable development, thereby transmitting more pressure to suppliers and promoting their digital transformation.
Furthermore, from the perspective of signal transmission theory, suppliers in the early stages of green innovation mainly rely on explicit incentives such as contract terms constraints and external funding subsidies (Ma et al., 2019), at which point the influence mechanism of manufacturer reputation is not obvious. When suppliers attempt to leverage green innovation to drive their digital transformation, they face challenges of multiplied resource investment and intensified cooperation risks. Technologies involved in this process, such as intelligent algorithm optimization and digital twin modeling, have high exclusivity. Unlike explicit green patent technology, the value realization of such proprietary technology relies more on deep trust and stable cooperative relationships among supply chain members (Chauhan et al., 2022). At this point, higher manufacturer reputation can serve as a good transmission signal, enhancing suppliers’ confidence in long-term cooperation stability and reducing suppliers’ concerns about financial and cooperative relationship stability.
Based on the above analysis, this study proposes Hypothesis 3:
H3: Manufacturer reputation moderates the relationship between supplier green innovation and supplier digital transformation.
2.4 The Moderating Role of Supplier Executives’ Innovation Consciousness and Green Cognition
Executive innovation consciousness can be understood as the executive team’s understanding and emphasis on organizational innovation. Higher innovation consciousness means executives are more inclined toward innovation-oriented management strategies and are more likely to adopt technological and organizational changes. Executive green cognition implies that executives possess green decision-making capabilities and resource acquisition capabilities; higher green cognition means executives are more inclined to adopt proactive green management strategies. Based on upper echelons theory, executives’ cognitive abilities, values, and psychological characteristics have important impacts on enterprise development (Hambrick and Mason, 1984). Supplier executive teams’ innovation consciousness and green cognition profoundly influence enterprise development paths by affecting key decisions such as strategic choices and resource allocation.
First, supplier executive teams with high innovation consciousness can more keenly identify and strengthen the utilization of supply chain knowledge spillover and capital spillover (Zhou and Zhao, 2024), more easily seize and utilize the spillover effects brought by manufacturers’ sustainable development performance, accelerate the utilization of development opportunities brought by manufacturers’ environmental commitments, and transform them into specific innovation R&D investment decisions for supplier enterprises. Second, innovation-oriented supplier executive teams tend to establish fault-tolerance mechanisms (Qinqin et al., 2023), alleviating the high-risk pressure in the early stages of enterprise green innovation. This organizational resilience ensures the sustainability of human and capital investment when suppliers pursue green innovation. Therefore, the higher the innovation consciousness of supplier executive teams, the more easily suppliers are driven by manufacturers’ sustainable development performance to engage in green innovation.
Based on resource-based view (Barney, 1991), digital transformation typically requires substantial resource investment and long-term strategic positioning, with relatively long return cycles. Executive green cognition, as an important intangible resource, means that executive teams with higher green cognition have a more long-term perspective (Tu et al., 2024), viewing digital transformation as an important means to achieve green strategic goals, thereby actively promoting digital transformation investment (Liu and Chen, 2024). In contrast, executive teams with low green cognition may only view green innovation as a short-term means to meet manufacturer requirements, finding it difficult to actively integrate it with digital transformation, resulting in limited promotion effect of green innovation on digital transformation. Therefore, the higher the level of supplier executive green cognition, the stronger the promotion effect of supplier green innovation on digital transformation.
Based on the above analysis, this study proposes Hypotheses 4 and 5:
H4: Supplier executives’ innovation consciousness moderates the relationship between manufacturers’ sustainable development performance and supplier green innovation.
H5: Supplier executives’ green cognition moderates the relationship between supplier green innovation and supplier digital transformation.
Based on the above analysis, manufacturer reputation moderates the effect of supplier green innovation on supplier digital transformation, supplier executives’ innovation consciousness moderates the effect of manufacturers’ sustainable development performance on supplier green innovation, and supplier executives’ green cognition moderates the effect of supplier green innovation on supplier digital transformation. Meanwhile, supplier green innovation plays a mediating role between manufacturers’ sustainable development performance and supplier digital transformation. Therefore, this study proposes a moderated mediation model, i.e., manufacturer reputation, supplier executives’ innovation consciousness, and green cognition moderate the mediating effect of manufacturers’ sustainable development performance on supplier digital transformation through supplier green innovation. Accordingly, this study proposes Hypotheses H6, H7, and H8:
H6: Manufacturer reputation moderates the mediating effect of manufacturers’ sustainable development performance on supplier digital transformation through supplier green innovation.
H7: Supplier executives’ innovation consciousness moderates the mediating effect of manufacturers’ sustainable development performance on supplier digital transformation through supplier green innovation.
H8: Supplier executives’ green cognition moderates the mediating effect of manufacturers’ sustainable development performance on supplier digital transformation through supplier green innovation.
In summary, the theoretical framework proposed in this study is shown in Figure 1:
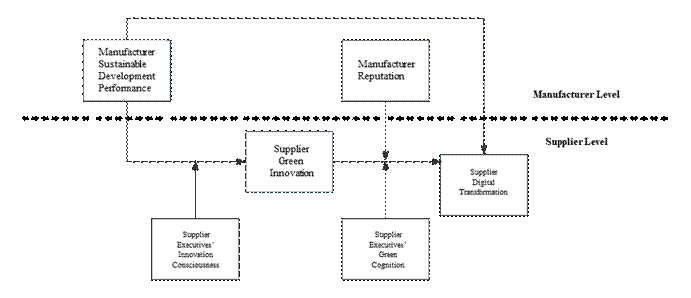
Figure 1. Theoretical Analysis Framework
3. Research Design
3.1 Sample Selection and Data Sources
This study takes Chinese A-share listed manufacturing companies and their corresponding suppliers as research samples, constructing a “manufacturer-supplier-year” panel dataset. Considering the potential lag in the effect of manufacturers’ sustainable development performance on supplier green innovation and to avoid reverse causality issues, this study uses manufacturer data from 2013-2022, with corresponding supplier data lagged by one period using 2014-2023 data. Subsequently, this study screens the samples as follows: (1) excluding enterprises with abnormal financial conditions such as ST and *ST; (2) according to the CSRC “Guidelines for Industry Classification of Listed Companies” (2012 version), excluding non-manufacturing enterprises such as finance and insurance; (3) excluding samples with variable missing rates exceeding 30%; (4) winsorizing continuous variables at the 1st percentile to avoid the influence of extreme values. After screening, 257 enterprises were obtained, forming 673 panel data observations. Enterprise financial data is sourced from the China Stock Market & Accounting Research (CSMAR) database and the CNRDS database. Green patent data is from the CNRDS database. Manufacturer-supplier matching relationship data is from the CSMAR supply chain database.
3.2 Variable Definitions
3.2.1 Dependent Variable
The dependent variable is supplier digital transformation (Digital). Existing research mainly uses methods such as text analysis and the proportion of intangible assets to total assets to measure supplier digital transformation, with text analysis becoming the mainstream method due to its high data accessibility and wide applicability. This study references Yuan et al. (2021) and uses text analysis to measure supplier digital transformation level. First, a digital transformation keyword library is established, including five categories of vocabulary: artificial intelligence technology, blockchain technology, cloud computing technology, big data technology, and digital technology application, totaling 32 keywords. Second, annual reports of suppliers from 2014-2023 are downloaded, and the Jieba word segmentation tool is used to segment the annual report text. Finally, the frequency of digital keywords appearing in annual reports is counted, and after adding 1 to the frequency, the natural logarithm is taken to obtain the supplier digital transformation indicator. Higher values of this indicator indicate higher levels of supplier digital transformation.
3.2.2 Independent Variable
The independent variable is manufacturer sustainable development performance (Sdp). This study references Alexopoulos et al. (2018) and comprehensively measures manufacturer sustainable development performance from two dimensions: financial performance and environmental social responsibility performance. Specific steps are as follows: (1) Financial performance is measured using return on assets (ROA), reflecting manufacturers’ profitability and resource utilization efficiency; (2) Environmental social responsibility performance is measured using the E dimension (environmental dimension) score (Score) from the Huazheng ESG rating, which comprehensively evaluates enterprise environmental performance from aspects such as pollution emissions, resource consumption, and environmental management. Higher scores indicate better environmental performance; (3) Entropy method is used to weight ROA and Score to obtain a comprehensive score measuring manufacturer sustainable development performance.
3.2.3 Mediator Variable
The mediator variable is supplier green innovation (GI). Existing research mainly uses indicators such as green patent quantity, R&D investment, and innovation efficiency to measure enterprise green innovation. Given that green patents can more accurately characterize substantive innovation outputs, this study references Furman et al. (2002) and Dosi et al. (2006) and measures enterprise green innovation capability through enterprise patent-related data. The number of green invention patent applications by listed enterprises is taken after adding 1, and then the natural logarithm is taken as the measure of supplier green innovation.
3.2.4 Moderator Variables
(1) Manufacturer Reputation (Rep): Existing research lacks a unified calculation method for measuring manufacturer reputation, with mainstream methods including financial indirect data method and text and big data analysis. Among them, the measurement based on media reports belongs to the category of text and big data analysis. This method has advantages of objective data and easy quantification. Therefore, this study references the media reputation theory proposed by Deephouse (2000), which holds that media evaluation is an effective indicator for measuring corporate reputation. Specifically, this study references its method of constructing reputation indicators based on media report tendencies, using newspaper and online news data compiled by the China Research Data Services Platform (CNRDS) to count the total number of positive news about manufacturers. After adding 1, the logarithm is taken to construct the manufacturer reputation indicator. Higher numbers of positive reports indicate higher natural logarithm values of this indicator, representing better manufacturer reputation.
(2) Supplier Executives’ Innovation Consciousness (Creativity): Existing research mostly uses text analysis based on keyword information in enterprise annual reports to measure executive innovation consciousness (Chen et al., 2015). This study conducts in-depth mining of listed company annual reports through text analysis, selecting ten keywords including “innovation,” “independent,” “R&D,” “scientific research,” “new products,” “new technology,” “development,” “research,” and “patent” for word frequency statistics. The ratio of the total word count of the above keywords to the total word count of the company’s annual report is calculated to construct the supplier executives’ innovation consciousness indicator, with the variable measured in percentage.
(3) Supplier Executives’ Green Cognition (EGC): Existing research often measures executives’ cognitive level in specific domains through keyword information text analysis (Osborne et al., 2001; Duriau et al., 2007). This study follows this method to analyze listed company annual reports, selecting 19 keywords based on three dimensions: green competitive advantage awareness, corporate social responsibility awareness, and external environmental pressure cognition, including “energy conservation and emission reduction,” “environmental protection strategy,” “environmental protection concept,” “environmental management institution,” “environmental education,” “environmental training,” “environmental technology development,” “environmental audit,” “energy conservation and environmental protection,” “environmental policy,” “environmental department,” “environmental inspection,” “low-carbon environmental protection,” “environmental work,” “environmental governance,” “environmental and environmental governance,” “environmental facilities,” “environmental laws and regulations,” and “environmental pollution control.” The total word count of the above keywords appearing in company annual reports is calculated, and the ratio of keyword word count to the total word count of the annual report is measured to construct the supplier executives’ green cognition indicator, measured in percentage.
3.2.5 Control Variables
Existing research in related fields commonly controls enterprise characteristic variables such as firm age, executive team size, and financial status as control variables. To ensure the rigor of model specification, this study, based on referencing existing research and combining the specific context of this research, systematically controls characteristic variables at manufacturer and supplier levels that may interfere with the dependent variable. Finally, manufacturer firm age (FirmAge_m), manufacturer executive size (Executives_m), manufacturer cash ratio (CashRatio_m), manufacturer separation of ownership and control (Seperate_m), manufacturer growth ability (Growth_m), manufacturer return on assets (ROA_m), supplier fixed asset ratio (FIXED_s), supplier firm age (FirmAge_s), supplier income tax rate (ITR_s), supplier audit fees (AuditFee_s), supplier operating leverage (OL_s), and supplier executive size (Executives_s) are selected as control variables. Variable definitions are shown in Table 1.
Table 1. Variable Definitions
| Variable Type | Variable Name | Variable Symbol | Variable Definition |
| Dependent Variable | Supplier Digital Transformation | Digital | Natural logarithm of the total frequency of digital transformation keywords appearing in enterprise annual reports plus 1 |
| Independent Variable | Manufacturer Sustainable Development Performance | Sdp | Comprehensive score calculated using entropy method for manufacturer return on assets and E dimension score from Huazheng ESG rating |
| Mediator Variable | Supplier Green Innovation | GI | Natural logarithm of the number of green invention patent applications by enterprise plus 1 |
| Moderator Variable | Manufacturer Reputation | Rep | Natural logarithm of the total number of positive newspaper and online news plus 1 |
| Supplier Executives’ Innovation Consciousness | Creativity | (Total word count of keywords / Total word count of company annual report) × 100 | |
| Supplier Executives’ Green Cognition | EGC | (Total word count of executives’ three dimensions of green cognition / Total word count of annual report) × 100 | |
| Control Variable | Manufacturer Firm Age | FirmAge_m | Natural logarithm of current year minus company establishment year plus 1 |
| Manufacturer Executive Size | Executives_m | Natural logarithm of number of executives | |
| Manufacturer Cash Ratio | CashRatio_m | Cash and cash equivalents ending balance / Current liabilities | |
| Manufacturer Separation of Ownership and Control | Seperate_m | Actual controller’s control proportion over listed company – Actual controller’s ownership proportion over listed company | |
| Manufacturer Growth Ability | Growth_m | (Current year operating revenue / Previous year operating revenue) – 1 | |
| Manufacturer Return on Assets | ROA_m | Net profit / Average total assets balance | |
| Supplier Fixed Asset Ratio | FIXED_s | Net fixed assets / Total assets | |
| Supplier Firm Age | FirmAge_s | Natural logarithm of current year minus company establishment year plus 1 | |
| Supplier Income Tax Rate | ITR_s | Income tax expense / Total profit | |
| Supplier Audit Fees | AuditFee_s | Natural logarithm of audit fees | |
| Supplier Operating Leverage | OL_s | (Net profit + Income tax expense + Financial expense + Depreciation + Amortization) / (Net profit + Income tax expense + Financial expense) | |
| Supplier Executive Size | Executives_s | Natural logarithm of number of executives |
4. Empirical Analysis
4.1 Descriptive Statistics
Table 2 presents the descriptive statistics results for main variables. First, the distribution characteristics of core variables show significant differences. The standard deviations for supplier digital transformation and green innovation are 1.065 and 2.068 respectively, indicating clear differentiation among different enterprises, which provides a good sample foundation for examining differential impacts. Second, the mean (0.178) of manufacturer sustainable development performance is lower than the median (0.212), indicating that this variable presents a left-skewed distribution, with some enterprises having lower sustainability performance pulling down the mean; overall, there is still considerable room for improvement in manufacturing sustainability performance. Additionally, the overall level of supplier executives’ green cognition is relatively low, but with small sample variability, indicating certain commonalities in cognitive levels across different enterprises. Finally, manufacturer reputation and supplier executives’ innovation consciousness both show reasonable variability, meeting the basic requirements for model analysis. Overall, the sample data presents good characteristics, providing a reliable foundation for subsequent empirical analysis.
Table 2. Descriptive Statistics
| Min | Max | Mean | Std. Dev. | Median | |
| Digital | 0.000 | 6.897 | 3.009 | 1.065 | 3.045 |
| Sdp1 | 0.012 | 1.007 | 0.178 | 0.193 | 0.212 |
| GI | 0.000 | 7.718 | 2.246 | 2.068 | 1.946 |
| EGC | 0.000 | 0.032 | 0.008 | 0.008 | 0.005 |
| Creativity | 0.095 | 4.661 | 1.204 | 0.600 | 1.140 |
| Rep | 1.386 | 7.169 | 4.364 | 0.956 | 4.331 |
4.2 Baseline Regression Results
Baseline regression results are shown in Table 3, where column (1) presents the regression results without control variables, and column (2) presents the regression results after adding control variables. Specifically, in column (1), the regression coefficient of manufacturer sustainable development performance on supplier digital transformation is significantly positive at the 10% level, indicating that manufacturer sustainable development performance can significantly promote supplier digital transformation. In column (2), after adding control variables, the regression coefficient of manufacturer sustainable development performance remains significantly positive, and the adjusted R² increases, indicating enhanced explanatory power of the model. This further demonstrates that manufacturer sustainable development performance can significantly promote supplier digital transformation (coefficient = 0.462, t = 2.370, p < 0.1), thus Hypothesis H1 is verified.
Table 3. Baseline Regression Results
| (1) | (2) | |
| Digital | Digital | |
| Sdp1 | 0.515* (2.435) | 0.462* (2.370) |
| Controls | No | Yes |
| Constant | 2.918*** (52.544) | -1.641* (-1.987) |
| N | 673 | 673 |
| Adj R² | 0.007 | 0.282 |
4.3 Robustness Tests
To verify the reliability of baseline regression results, this study designs robustness test schemes from four aspects as follows:
(1) Adding new control variables. Existing research indicates that enterprise characteristics such as size and growth may have potential impacts on supplier digital transformation (M. Li and Wei, 2024). To avoid statistical errors caused by omitted variables, this study further incorporates manufacturer enterprise size (Size_m), supplier enterprise size (Size_s), and supplier enterprise growth (Growth_s) into the baseline regression control variable set, reconstructing the regression model for testing. As shown in column (1) of Table 4, the regression coefficient of manufacturer sustainable development performance on supplier digital transformation is 0.473, and it is significantly positive at the 5% statistical level (t = 2.376). This result is consistent with the baseline regression conclusion, indicating that after controlling for more enterprise characteristic variables, the promoting effect of manufacturer sustainable development performance on supplier digital transformation remains robust.
(2) Alternative measurement of dependent variable. To reduce measurement error of supplier digital transformation, this study constructs an alternative indicator (Digital2) using “total frequency of enterprise digital transformation related keywords / MD&A section length of annual report × 100” to re-estimate the baseline model (Yang and Lin, 2025). Column (2) of Table 4 shows that the effect coefficient of Sdp1 on Digital2 is 0.698, and it is significant at the 1% level (t = 2.985). This result again verifies that improvement in manufacturer sustainable development performance can significantly promote deepening of supplier digital transformation, further supporting the validity of H1.
(3) Adjusting the measurement of independent variable. To more robustly characterize manufacturer sustainable development performance from multiple dimensions, this study further adjusts the construction method of dual-dimension indicators based on the comprehensive indicator of financial performance and non-financial performance used in the baseline model, referencing Shrivastava and Addas (2014), to construct a new manufacturer sustainable development performance indicator (Sdp2). Financial performance is still measured using return on assets, reflecting enterprise economic growth capability; non-financial performance is adjusted to use the total Huazheng ESG score, to more comprehensively reflect enterprise performance in social value creation and ecological environmental protection, finally synthesizing Sdp2 through entropy method. Re-running the regression test on the baseline model, results shown in column (3) of Table 4 indicate that the regression coefficient of Sdp2 on supplier digital transformation is 0.496, significantly positive at the 10% level (t = 2.263), further verifying the robustness of the main effect.
(4) Excluding exogenous shock interference. Within the research span of this study, the COVID-19 pandemic outbreak from 2020-2022 had exogenous impacts on enterprise production, operation, and development, which may interfere with the true relationship between core variables. To exclude this interference, this study adjusts the sample period to 2013-2019 (pre-pandemic) and re-runs regression tests. Column (4) of Table 4 shows that the regression coefficient of manufacturer sustainable development performance on supplier digital transformation is 0.589, and it is significantly positive at the 5% level (t = 2.468). This indicates that after excluding the exogenous shock of the pandemic, the baseline regression conclusion still holds, further proving that H1’s validity is not affected by special external shocks.
Table 4. Robustness Tests
| (1) | (2) | (3) | (4) | |
| Digital | Digital2 | Digital | Digital | |
| Sdp1 | 0.473* (2.376) | 0.698** (2.985) | 0.589* (2.468) | |
| Sdp2 | 0.496* (2.263) | |||
| Size_m | 0.035 (1.087) | |||
| Size_s | -0.121* (-2.181) | |||
| Growth_s | -0.057 (-0.403) | |||
| Controls | Yes | Yes | Yes | Yes |
| Constant | -1.916* (-2.002) | -1.190 (-1.192) | -2.136* (-2.536) | -1.633 (-1.543) |
| N | 673 | 673 | 673 | 393 |
| Adj R² | 0.285 | 0.265 | 0.282 | 0.279 |
4.4 Mechanism Testing
Mediation Effect
To verify the mediation path (H2) where manufacturer sustainable development performance affects supplier digital transformation through influencing supplier green innovation, this study references the causal stepwise regression method proposed by Baron et al. (1986) and combines it with Bootstrap test for analysis. The specific procedure consists of the following four steps.
Step 1: Test the total effect of the core independent variable on the dependent variable. Column (1) of Table 5 shows that the coefficient of Sdp1 on Digital is 0.462, and it is significant at the 10% level (t = 2.370), indicating that improvement in manufacturer sustainable development performance can significantly promote supplier digital transformation, laying the foundation for mediation effect testing.
Step 2: Test the effect of the core independent variable on the mediator variable. Column (2) of Table 5 shows that the coefficient of Sdp1 on supplier GI is 1.377, significantly positive at the 1% level (t = 4.256), indicating that improvement in manufacturer sustainable development performance can effectively promote suppliers to engage in green innovation activities, satisfying the necessary condition for mediation effect testing.
Step 3: Simultaneously include the core independent variable and mediator variable to test whether the mediation effect exists. Column (3) of Table 5 shows that the coefficient of GI on Digital is 0.060, significantly positive at the 10% level (t = 2.413), while the coefficient of Sdp1 decreases to 0.380 and is no longer significant (t = 1.926). This indicates that supplier green innovation plays a full mediating role between manufacturer sustainable development performance and supplier digital transformation, i.e., manufacturer sustainable development performance promotes supplier digital transformation through promoting supplier green innovation.
Step 4: To further confirm the robustness of the mediation effect, this study uses the Bootstrap method for testing. Bootstrap test results (5,000 samplings, 95% confidence interval) show that the mediation effect value is 0.082, and the confidence interval does not include 0, further confirming that the mediation effect of supplier green innovation exists robustly. In summary, Hypothesis H2 is fully verified.
Table 5. Mediation Effect Test of Supplier Green Innovation
| (1) | (2) | (3) | |
| Digital | GI | Digital | |
| Sdp1 | 0.462* (2.370) | 1.377*** (4.256) | 0.380 (1.926) |
| GI | 0.060* (2.413) | ||
| Controls | Yes | Yes | Yes |
| Constant | -1.641* (-1.987) | -20.026*** (-14.615) | -0.443 (-0.461) |
| N | 673 | 673 | 673 |
| Adj R² | 0.282 | 0.482 | 0.288 |
| Mediation Effect Value | 0.082 | 0.082 | 0.082 |
| Bootstrap Test | [0.003, 0.030] | [0.003, 0.030] | [0.003, 0.030] |
Moderation Effect
This study further tests the moderating effects of manufacturer reputation, supplier executives’ innovation consciousness, and supplier executives’ green cognition. Results are shown in Table 6, where columns (1), (2), and (3) present the moderation effect test results for manufacturer reputation; columns (4), (5), and (6) present the moderation effect test results for supplier executives’ innovation consciousness; columns (7), (8), and (9) present the moderation effect test results for supplier executives’ green cognition.
From column (3), the interaction term of supplier green innovation and manufacturer reputation has a significant positive effect on supplier digital transformation (β = 0.060, p < 0.01), indicating that the higher the manufacturer reputation, the stronger the positive promoting effect of supplier green innovation on digital transformation, i.e., manufacturer reputation plays a positive moderating role in this path, thus H3 is preliminarily supported. From column (6), the interaction term of manufacturer sustainable development performance and supplier executives’ innovation consciousness has a significant positive effect on supplier green innovation (β = 1.197, p < 0.1), indicating that the higher the supplier executives’ innovation consciousness, the more it can strengthen the positive effect of manufacturer sustainable development performance on supplier green innovation, thus H4 is preliminarily supported. Similarly, from column (9), the interaction term of supplier green innovation and supplier executives’ green cognition has a significant positive effect on supplier digital transformation (β = 7.897, p < 0.05), thus H5 is verified.
To further clarify the direction and trend of moderation effects, using the mean and its upper and lower one standard deviation as standards, manufacturer reputation, supplier executives’ innovation consciousness, and supplier executives’ green cognition are divided into high, medium, and low levels, and three simple slope plots of regression effects are established respectively. As shown in Figure 2, compared with low manufacturer reputation and average manufacturer reputation, the positive effect of supplier green innovation on supplier digital transformation is significantly enhanced under high manufacturer reputation. Figure 3 shows that supplier executives’ innovation consciousness is a key internal driving factor. In environments with high innovation consciousness, the stimulating effect of manufacturer sustainable development performance on supplier green innovation is significantly amplified, revealing the importance of executive team innovation orientation for internalizing external pressure and guidance. Figure 4 shows that when supplier executives’ green cognition rises from low to high level, the marginal effect of supplier green innovation on digital transformation shows an obvious increasing trend, indicating that high supplier executives’ green cognition can promote the strategic synergy between green innovation and digital transformation.
Table 6. Moderation Effect Tests
| (1) | (2) | (3) | (4) | (5) | (6) | (7) | (8) | (9) | |
| Digital | Digital | Digital | GI | GI | GI | Digital | Digital | Digital | |
| Sdp1 | 1.328*** (4.076) | 1.347*** (4.134) | 1.416*** (4.333) | ||||||
| GI | 0.066** (2.709) | 0.067** (2.747) | 0.066** (2.753) | 0.068** (2.783) | 0.072** (2.942) | 0.085*** (3.395) | |||
| Rep | -0.103* (-2.571) | -0.103* (-2.577) | |||||||
| GI×Rep | 0.060*** (3.350) | ||||||||
| Creativity | 0.161 (1.379) | 0.192 (1.638) | |||||||
| Sdp1×Creativity | 1.197* (2.003) | ||||||||
| EGC | -8.320 (-1.536) | -7.898 (-1.464) | |||||||
| GI×EGC | 7.897** (2.585) | ||||||||
| Controls | Yes | Yes | Yes | Yes | Yes | Yes | Yes | Yes | Yes |
| Constant | -0.225 (-0.227) | -0.033 (-0.033) | -0.068 (-0.069) | -18.140*** (-12.860) | -18.359*** (-12.944) | -18.438*** (-13.030) | -0.204 (-0.205) | -0.134 (-0.135) | -0.347 (-0.350) |
| N | 597 | 597 | 597 | 572 | 572 | 572 | 599 | 599 | 599 |
| Adj R² | 0.288 | 0.295 | 0.307 | 0.412 | 0.413 | 0.416 | 0.285 | 0.286 | 0.293 |
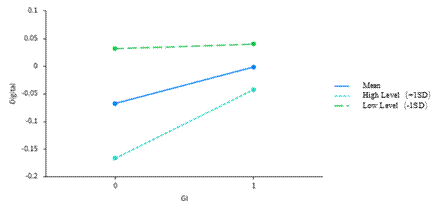
Figure 2. Moderating Effect of Manufacturer Reputation on the “GI-Digital” Path
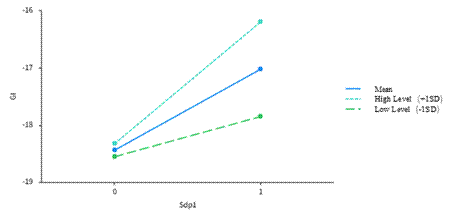
Figure 3. Moderating Effect of Supplier Executives’ Innovation Consciousness on the “Sdp1-GI” Path
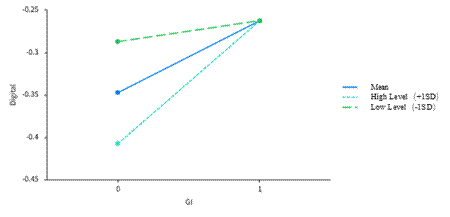
Figure 4. Moderating Effect of Supplier Executives’ Green Cognition on the “GI-Digital” Path
Moderated Mediation Effect Testing
To ensure the robustness of results, this study uses the Bootstrap method to test the moderated mediation effects. As shown in Table 7, for the mediator variable GI, when the moderator manufacturer reputation is below one standard deviation, the boot 95% CI includes zero, indicating no mediation effect at this level; when the moderator manufacturer reputation is at the mean level, the boot 95% CI does not include zero, indicating a mediation effect at this level, with an Effect value of 0.078; when the moderator manufacturer reputation is above one standard deviation, the boot 95% CI does not include zero, indicating a mediation effect at this level, with an Effect value of 0.167. This indicates that the higher the manufacturer reputation, the stronger the mediating effect of supplier green innovation between manufacturer sustainable development performance and supplier digital transformation, i.e., there exists a moderated mediation effect with manufacturer reputation as the moderator variable, thus supporting Hypothesis H6.
From Table 8, supplier executives’ innovation consciousness shows a clear moderating trend for the mediator variable GI. When this variable is at a low level, the mediation effect is not significant; at the mean level, the effect value is 0.086, and the confidence interval rejects the null hypothesis; further at a high level, the effect value increases to 0.217, indicating significantly enhanced mediation effect. This analysis clearly points out the moderating effect of supplier executives’ innovation consciousness on the mediation path, i.e., the stronger their innovation consciousness, the more significant the mediating effect of supplier green innovation between manufacturer sustainable development performance and supplier digital transformation, thus supporting Hypothesis H7.
From Table 9, the moderating effect of supplier executives’ green cognition on the mediation path is also verified. When supplier executives’ green cognition is at a low level, its mediation effect is not significant (boot 95% CI includes 0); when this cognition level rises to the mean, the mediation effect begins to emerge (Effect = 0.105, 95% CI does not include 0); when its cognition level further rises to above one standard deviation, the mediation effect value increases to 0.178, and the significance further strengthens. This clear gradient change indicates that the higher the level of supplier executives’ green cognition, the stronger the mediating effect played by green innovation, thus Hypothesis H8 is supported.
Table 7. Indirect Effects of Different Manufacturer Reputation Levels on the “Sdp1-Digital” Path
| Mediator Variable | Manufacturer Reputation (Rep) | Level Value | Effect | BootSE | BootLLCI | BootULCI |
| GI | M-1SD | 3.417 | 0.000 | 0.036 | -0.068 | 0.082 |
| GI | M | 4.384 | 0.078 | 0.037 | 0.018 | 0.166 |
| GI | M+1SD | 5.351 | 0.167 | 0.063 | 0.061 | 0.306 |
Note: M represents the mean; M-1SD represents one standard deviation below the mean; M+1SD represents one standard deviation above the mean.
Table 8. Indirect Effects of Different Supplier Executives’ Innovation Consciousness Levels on the “Sdp1-Digital” Path
| Mediator Variable | Supplier Executives’ Innovation Consciousness (Creativity) | Level Value | Effect | BootSE | BootLLCI | BootULCI |
| GI | M-1SD | 0.611 | 0.014 | 0.027 | -0.032 | 0.078 |
| GI | M | 1.207 | 0.086 | 0.040 | 0.019 | 0.175 |
| GI | M+1SD | 1.804 | 0.217 | 0.091 | 0.060 | 0.420 |
Note: M represents the mean; M-1SD represents one standard deviation below the mean; M+1SD represents one standard deviation above the mean.
Table 9. Indirect Effects of Different Supplier Executives’ Green Cognition Levels on the “Sdp1-Digital” Path
| Mediator Variable | Supplier Executives’ Green Cognition (EGC) | Level Value | Effect | BootSE | BootLLCI | BootULCI |
| GI | M-1SD | -0.000 | 0.027 | 0.045 | -0.056 | 0.125 |
| GI | M | 0.008 | 0.105 | 0.040 | 0.036 | 0.191 |
| GI | M+1SD | 0.015 | 0.178 | 0.069 | 0.051 | 0.320 |
Note: M represents the mean; M-1SD represents one standard deviation below the mean; M+1SD represents one standard deviation above the mean.
5. Heterogeneity Analysis
Different characteristics of supplier enterprises often lead to differences in the effect of manufacturer sustainable development performance on supplier digital transformation. Therefore, heterogeneity analysis is further conducted from three dimensions: supplier enterprise nature, supplier enterprise size, and supplier enterprise position.
5.1 Supplier Enterprise Nature
In supply chain cooperative relationships, differences in supplier enterprise nature lead to significant differences in resource acquisition capability, risk tolerance, and decision-making mechanisms, and these differences may further affect the promoting effect of manufacturer sustainable development performance on supplier digital transformation. For example, state-owned enterprises can typically rely on government backgrounds and policy support to obtain stable green credit and R&D subsidies, thereby setting higher requirements for their own sustainable development performance and suppliers’ digitalization level. Therefore, it is necessary to conduct heterogeneity analysis for supplier enterprise nature. This study divides the full sample into state-owned enterprise group and non-state-owned enterprise group based on supplier enterprise ownership nature, and conducts regression analysis separately for the two groups to compare and test the differences in the effect of manufacturer sustainable development performance on supplier digital transformation of different enterprise natures.
Regression results are shown in columns (1) and (2) of Table 10. The regression coefficient of manufacturer sustainable development performance on supplier digital transformation for the state-owned supplier group is 0.682, and it is significant at the 5% statistical level; for the non-state-owned supplier group, the regression coefficient is only 0.067 and not significant. This indicates that the promoting effect of manufacturer sustainable development performance on state-owned supplier digital transformation is far stronger than for non-state-owned suppliers. This difference reflects that, in China’s institutional environment and market background, state-owned enterprises possess natural advantages in resource acquisition and risk resistance. On one hand, state-owned enterprises can typically obtain more government subsidies, lower-cost financing support, and more stable procurement collaboration resources, with lower financing constraints (Wu et al., 2024), enabling them to more easily bear the high initial investment required for digital transformation. On the other hand, state-owned enterprises bear heavier social responsibility expectations and policy implementation obligations, and have stronger sensitivity and response ability to sustainable development requirements from manufacturers.
5.2 Supplier Enterprise Size
Enterprise size is a key factor affecting its technology investment capability and transformation implementation efficiency. Large-scale suppliers and small and medium-scale suppliers have obvious gaps in financial strength, technological reserves, and digitalization experience (Eller et al., 2020), which may lead to different characteristics when responding to manufacturer sustainable development requirements and advancing digital transformation. Based on this, it is necessary to conduct heterogeneity analysis based on supplier enterprise size. This study uses the annual average of supplier enterprise total assets as the division standard, classifying samples with total assets above the average as large-scale supplier group and samples with total assets below or equal to the average as small and medium-scale supplier group, then conducting separate regression tests for the two groups.
Regression results are shown in columns (3) and (4) of Table 10. The regression coefficient of manufacturer sustainable development performance on supplier digital transformation for the large-scale supplier group is 0.469, significant at the 10% statistical level; for the small and medium-scale supplier group, the regression coefficient is 0.189 and not significant. This indicates that the promoting effect of manufacturer sustainable development performance on large-scale supplier digital transformation is more prominent. This is mainly because large-scale suppliers typically possess stronger financial strength, able to bear high costs such as hardware procurement, software development, and talent training required for digital transformation; meanwhile, their complete technological reserves and rich digitalization experience enable them to quickly match digitalization standards under manufacturer sustainable development requirements and efficiently connect with manufacturer collaboration needs, thereby accelerating the transformation process. Small and medium-scale suppliers, constrained by funding limitations (Zhang and Bu, 2024), often face difficulties in making substantial investments in digital infrastructure and technological upgrades.
5.3 Supplier Enterprise Position
In supply chains, the position of suppliers determines their voice, resource acquisition channels, and institutional pressures faced (Itzkowitz, 2013), and these factors directly affect suppliers’ willingness and ability to respond to manufacturer sustainable development requirements. Suppliers at different positions may exhibit different transformation behaviors when responding to manufacturer driving forces.
Referencing existing research (Patatoukas, 2012), customer concentration is used as a proxy variable for measuring supplier position. This study uses the ratio of sales to top five customers to enterprise’s total annual sales to measure supplier customer concentration (Dong et al., 2020), where higher customer concentration indicates stronger supplier dependence on core customers and lower position in the supply chain. Based on the distribution characteristics of customer concentration, the full sample is divided into low position, medium position, and high position groups, and group regression is used to test the effect of manufacturer sustainable development performance on supplier digital transformation at different positions.
Regression results are shown in columns (5), (6), and (7) of Table 10. The regression coefficient of manufacturer sustainable development performance on supplier digital transformation for the medium position supplier group is 0.934, significant at the 5% statistical level; for the low position and high position supplier groups, the coefficients are 0.057 and 0.173 respectively, and neither group passed the statistical significance test. This indicates that the promoting effect of manufacturer sustainable development performance on medium position supplier digital transformation is significantly stronger than for the other two groups. From institutional theory perspective, medium position suppliers face dual institutional pressures from the “sandwich effect” (Bennich, 2024): on one hand, they need to meet increasingly strict sustainability compliance requirements from upstream manufacturers to maintain cooperative relationships; on the other hand, they need to maintain advantages in downstream market competition to avoid being replaced. This dual pressure gives them stronger motivation for digital transformation. From resource-based view perspective, medium position suppliers possess certain resource bases and bargaining power, enabling them to effectively respond to manufacturer sustainability requirements without facing resource constraints like low position suppliers or lacking sufficient external motivation like high position suppliers.
Table 10. Heterogeneity Test Results
| Digital | Digital | Digital | Digital | Digital | Digital | Digital | |
| (1) | (2) | (3) | (4) | (5) | (6) | (7) | |
| State-owned | Non-state-owned | SME | Large | Low Position | Medium Position | High Position | |
| Sdp1 | 0.682** (2.962) | 0.067 (0.216) | 0.189 (0.563) | 0.469* (2.107) | 0.057 (0.195) | 0.934** (3.192) | 0.173 (0.348) |
| Controls | Yes | Yes | Yes | Yes | Yes | Yes | Yes |
| Constant | -5.508*** (-5.184) | -0.942 (-0.660) | -4.790** (-2.627) | 0.304 (0.225) | -0.145 (-0.079) | -2.115 (-1.663) | -2.199 (-1.225) |
| N | 322 | 278 | 294 | 306 | 162 | 258 | 151 |
| Adj R² | 0.398 | 0.275 | 0.287 | 0.333 | 0.480 | 0.265 | 0.188 |
6. Conclusions and Recommendations
6.1 Research Conclusions
Against the macro backdrop of dual drivers from global Sustainable Development Goals (SDGs) and China’s “Dual Carbon” strategy, sustainable development in manufacturing and its impact on supply chain partners’ digital transformation have received increasing attention. This study takes Chinese A-share market manufacturing listed companies and their upstream suppliers from 2013 to 2022 as research objects, establishes a “manufacturer-supplier-year” panel data system, and with the help of a moderated mediation analysis framework, comprehensively employs multi-level empirical strategies including baseline regression, robustness tests, and heterogeneity analysis to deeply analyze the underlying logic and boundary conditions of manufacturer sustainable development performance affecting supplier digital transformation. The main research conclusions are as follows:
First, manufacturer sustainable development performance has a significant positive driving effect on supplier digital transformation. Baseline regression results show that after controlling for multiple characteristic variables at manufacturer and supplier levels, the regression coefficient of manufacturer sustainable development performance is 0.462 (t = 2.370), significantly positive at the 10% level. In robustness tests, after validation through four methods including adding control variables, replacing variable measurement methods, changing data sources, and excluding exogenous shocks, the regression coefficient of the core independent variable consistently remains between 0.473-0.698 and passes significance tests, confirming the stability of this driving relationship. The above results indicate that improvement in manufacturers’ comprehensive performance in economic and environmental dimensions can effectively promote supplier digital transformation processes through stakeholder pressure transmission, dual knowledge and financial spillover effects, and supply chain trust mechanism construction.
Second, supplier green innovation plays a full mediating role in the above main effect. Mechanism test results show that the regression coefficient of manufacturer sustainable development performance on supplier green innovation is 1.377 (t = 4.256), significantly positive at the 1% level; when simultaneously including the core independent variable and mediator variable, the coefficient of supplier green innovation on digital transformation is 0.060 (t = 2.413), significant at the 10% level, and Bootstrap test further verifies the mediation effect value of 0.082. This means that manufacturer sustainable development performance promotes supplier digital transformation by promoting supplier green innovation, providing financial support (such as green credit access) and technical support (such as data collection and analysis capability accumulation) for it, thereby achieving transformation empowerment.
Third, manufacturer reputation, supplier executives’ innovation consciousness, and green cognition play significant moderating roles. Moderation effect tests show: the interaction term coefficient of manufacturer reputation and supplier green innovation is 0.060 (p < 0.01), indicating that high reputation manufacturers can enhance suppliers’ confidence in cooperation stability and strengthen the promoting effect of green innovation on digital transformation; the interaction term coefficient of supplier executives’ innovation consciousness and manufacturer sustainable development performance is 1.197 (p < 0.1), indicating that executive teams with high innovation consciousness can more efficiently utilize supply chain spillover effects and accelerate green innovation processes; the interaction term coefficient of supplier executives’ green cognition and green innovation is 7.897 (p < 0.05), indicating that high green cognition levels can promote strategic synergy between green innovation and digital transformation.
Fourth, the above moderating variables all significantly affect the strength of mediation effects. Moderated mediation tests show that when manufacturer reputation, supplier executives’ innovation consciousness, and green cognition are at mean plus one standard deviation level, the mediation effect values increase to 0.167, 0.217, and 0.178 respectively, significantly higher than the mean level, indicating that these moderating factors positively strengthen the effect of the mediation path.
Fifth, heterogeneity analysis reveals contextual differences in the effect of the main path. Heterogeneity analysis results show that manufacturer sustainable development performance has more significant promoting effects on digital transformation of state-owned suppliers (coefficient 0.682, p < 0.05), large-scale suppliers (coefficient 0.469, p < 0.1), and medium position suppliers (coefficient 0.934, p < 0.05). This reflects that contextual factors such as enterprise nature, size, and supply chain position have significant constraining effects on the actual effect of the main path.
6.2 Research Recommendations
Based on the above research conclusions, this study proposes targeted recommendations from three levels: manufacturers, suppliers, and government:
Manufacturers should elevate sustainable development to a core strategic position and release supply chain spillover effects through multi-dimensional initiatives. First, establish a sustainable supplier management system, incorporating digital transformation requirements into supplier cooperation agreements, transmitting transformation pressure through carbon footprint tracking and environmental standard co-construction, while establishing green innovation special subsidies to alleviate supplier transformation funding constraints. Second, build a supply chain digital collaboration platform, relying on blockchain technology to achieve real-time sharing of environmental technology knowledge and production process data, conducting joint R&D projects to transform accumulated green technology and process optimization experience into technical support for supplier digital transformation. Third, emphasize reputation asset cultivation, enhancing brand reputation through publishing sustainable development reports and participating in industry green certifications, strengthening supplier confidence in long-term cooperation, and reinforcing the synergy between green innovation and digital transformation.
Suppliers need to actively absorb manufacturer sustainable development spillover effects, transforming external pressure into internal transformation motivation. First, increase green innovation investment intensity, obtaining policy subsidies and market competitive advantages through green patent applications to accumulate technical and financial foundations for digital transformation. Second, enhance executive team strategic literacy, strengthening executives’ innovation consciousness and green cognition through introducing expert consultants in green management and conducting digital transformation special training. Third, establish innovation fault-tolerance mechanisms, for example, setting reasonable fault-tolerance space and reward weights for exploratory green innovation projects in performance evaluation, ensuring sustained resource investment for such long-term transformation projects. Finally, suppliers should seize policy opportunities, actively connecting with local digital economy and green low-carbon industrial cluster construction planning, sharing public computing power, common technology platforms, and industry datasets by entering industrial parks or industrial internet platforms, effectively reducing the unique costs of digital transformation.
Government should build a precision-oriented and inclusive policy support system to promote supply chain collaborative transformation. First, implement differentiated incentive policies, incorporating supply chain collaborative emission reduction effectiveness and supplier digital transformation coverage into green credit approval and fiscal subsidy disbursement assessment indicators, providing tax incentives to manufacturers with significant achievements in driving supplier transformation. Second, build public service platforms, integrating green technology solutions, digital tool resources, and talent training courses, tilting toward small and medium-scale suppliers to reduce their transformation technology thresholds and funding pressures. Third, improve institutional guarantee mechanisms, issuing supply chain digital transformation standard specifications, establishing environmental information disclosure sharing mechanisms, and strengthening third-party evaluation of manufacturer sustainable development performance, creating a favorable institutional environment for supply chain collaborative transformation.
6.3 Research Prospects
This study provides an empirical foundation for understanding how manufacturer sustainable development performance drives supplier digital transformation, inspiring future scholars to further deepen research from dimensions such as technical tools and research objects. First, at the technical tool level, with the rapid development of artificial intelligence technologies represented by large language models and machine learning, future research can actively introduce these cutting-edge tools to more precisely measure enterprise digitalization processes and green innovation capabilities. For example, leveraging large language models to deeply mine and analyze enterprise unstructured texts (such as social responsibility reports, patent texts), constructing more objective and dynamic evaluation systems for core variables such as digital transformation and green innovation. Second, at the research object level, supply chain digital transformation is not only a proposition for listed companies. Subsequent research can expand the sample scope, incorporating diverse subjects such as non-listed enterprises, suppliers of different sizes and industries into the analysis framework. By examining the digitalization driving mechanisms of enterprises of different sizes and at different development stages, comparing the applicability and differences of research conclusions in different contexts, the external validity and practical guidance value of the research can be enhanced.
References
Ahmad, M., Akram, W., Ikram, M., Shah, A. A., Rehman, A., Chandio, A. A., & Jabeen, G. (2021). Estimating dynamic interactive linkages among urban agglomeration, economic performance, carbon emissions, and health expenditures across developmental disparities. Sustainable Production and Consumption, 27, 1643–1657.
Alexopoulos, I., Kounetas, K., & Tzelepis, D. (2018). Environmental and financial performance. Is there a win-win or a win-loss situation? Evidence from the Greek manufacturing. Journal of Cleaner Production, 197, 1275–1283.
Arrow, K. J. (1972). Economic Welfare and the Allocation of Resources for Invention. In C. K. Rowley (Ed.), Readings in Industrial Economics (pp. 219–236). Macmillan Education UK.
Bennich, A. (2024). The digital imperative: Institutional pressures to digitalise. Technology in Society, 76, 102436.
Caiado, R. G. G., Machado, E., Santos, R. S., Thomé, A. M. T., & Scavarda, L. F. (2024). Sustainable I4.0 integration and transition to I5.0 in traditional and digital technological organisations. Technological Forecasting and Social Change, 207, 123582.
Chang, R.-D., Zuo, J., Zhao, Z.-Y., Zillante, G., Gan, X.-L., & Soebarto, V. (2017). Evolving theories of sustainability and firms: History, future directions and implications for renewable energy research. Renewable and Sustainable Energy Reviews, 72, 48–56.
Chauhan, C., Kaur, P., Arrawatia, R., Ractham, P., & Dhir, A. (2022). Supply chain collaboration and sustainable development goals (SDGs). Teamwork makes achieving SDGs dream work. Journal of Business Research, 147, 290–307.
Chen, Y., Podolski, E. J., & Veeraraghavan, M. (2015). Does managerial ability facilitate corporate innovative success? Journal of Empirical Finance, 34, 313–326.
Clarkson, M. E. (1995). A Stakeholder Framework for Analyzing and Evaluating Corporate Social Performance. Academy of Management Review, 20(1), 92–117.
Deephouse, D. L. (2000). Media Reputation as a Strategic Resource: An Integration of Mass Communication and Resource-Based Theories. Journal of Management, 26(6), 1091–1112.
Dong, Y., Skowronski, K., Song, S., Venkataraman, S., & Zou, F. (2020). Supply base innovation and firm financial performance. Journal of Operations Management, 66(7–8), 768–796.
Dosi, G., Marengo, L., & Pasquali, C. (2006). How much should society fuel the greed of innovators?: On the relations between appropriability, opportunities and rates of innovation. Research Policy, 35(8), 1110–1121.
Duriau, V. J., Reger, R. K., & Pfarrer, M. D. (2007). A Content Analysis of the Content Analysis Literature in Organization Studies: Research Themes, Data Sources, and Methodological Refinements. Organizational Research Methods, 10(1), 5–34.
Eller, R., Alford, P., Kallmünzer, A., & Peters, M. (2020). Antecedents, consequences, and challenges of small and medium-sized enterprise digitalization. Journal of Business Research, 112, 119–127.
Fang, Z. (2024). A Literature Review on the Digital Transformation of State-owned Enterprises. International Journal of Global Economics and Management, 5(3), 210–218.
Florez-Jimenez, M. P., Lleo, A., Ruiz-Palomino, P., & Muñoz-Villamizar, A. F. (2025). Corporate sustainability, organizational resilience, and corporate purpose: A review of the academic traditions connecting them. Review of Managerial Science, 19(1), 67–104.
Fombrun, C., & Shanley, M. (1990). WHAT’S IN A NAME? REPUTATION BUILDING AND CORPORATE STRATEGY. Academy of Management Journal, 33(2), 233–258.
Furman, J. L., Porter, M. E., & Stern, S. (2002). The determinants of national innovative capacity. Research Policy, 31(6), 899–933.
Ghobakhloo, M., Mahdiraji, H. A., Iranmanesh, M., & Jafari-Sadeghi, V. (2024). From Industry 4.0 Digital Manufacturing to Industry 5.0 Digital Society: A Roadmap Toward Human-Centric, Sustainable, and Resilient Production. Information Systems Frontiers.
Hambrick, D. C., & Mason, P. A. (1984). Upper Echelons: The Organization as a Reflection of Its Top Managers. The Academy of Management Review, 9(2), 193.
Huang, C., Chang, X., Wang, Y., & Li, N. (2023). Do major customers encourage innovative sustainable development? Empirical evidence from corporate green innovation in China. Business Strategy and the Environment, 32(1), 163–184.
Itzkowitz, J. (2013). Customers and cash: How relationships affect suppliers’ cash holdings. Journal of Corporate Finance, 19, 159–180.
Kim, S., & Kim, C. (2024). Enhancing logistics performance through increased trust and collaboration in supply chain risk management: A focus on the distribution network of manufacturing companies. Systems, 12(4), 141.
Kinney, M. R., & Wempe, W. F. (2002). Further evidence on the extent and origins of JIT’s profitability effects. Accounting Review, 77(1), 203–225.
Kutsuna, K., Smith, J. K., Smith, R., & Yamada, K. (2016). Supply-chain spillover effects of IPOs. Journal of Banking & Finance, 64, 150–168.
Le, Y. (2025). Digital Transformation, TOE Framework and Green Innovation of Energy Enterprises. Advances in Economics and Management Research, 13(1), 601–601.
Li, M., & Wei, L. (2024). The path of digital transformation driving enterprise growth: The moderating role of financing constraints. International Review of Financial Analysis, 96, 103536.
Li, R., Rao, J., & Wan, L. (2022). The digital economy, enterprise digital transformation, and enterprise innovation. Managerial and Decision Economics, 43(7), 2875–2886.
Li, X., Rehman, A. U., Toma, S., Jaradat, M., Lv, X., Mihai, D. M., Spinu, A. E., & Shabbir, M. S. (2024). Does corporate social sustainability influence on business environment? Impact of corporate governance on distance to default of Sukuk issuers in Islamic banks. International Review of Economics & Finance, 94, 123–138.
Li, Z., Zhang, X., Tao, Z., & Wang, B. (2024). Enterprise digital transformation and supply chain management. Finance Research Letters, 60, 104883.
Liu, F., Wang, R., & Fang, M. (2024). Mapping green innovation with machine learning: Evidence from China. Technological Forecasting and Social Change, 200, 123107.
Liu, Y., & Chen, Y. (2024). Executives’ green cognition and corporate green innovation: Evidence from China. Total Quality Management & Business Excellence, 35(9–10), 1054–1075.
Ma, W., Zhang, R., & Chai, S. (2019). What drives green innovation? A game theoretic analysis of government subsidy and cooperation contract. Sustainability, 11(20), 5584.
Oliveira, M., Zancul, E., & Salerno, M. S. (2024). Capability building for digital transformation through design thinking. Technological Forecasting and Social Change, 198, 122947.
Osborne, J. D., Stubbart, C. I., & Ramaprasad, A. (2001). Strategic groups and competitive enactment: A study of dynamic relationships between mental models and performance. Strategic Management Journal, 22(5), 435–454.
Patatoukas, P. N. (2012). Customer-base concentration: Implications for firm performance and capital markets: 2011 American accounting association competitive manuscript award winner. The Accounting Review, 87(2), 363–392.
Qinqin, Z., Ruixing, L. I. N., & Weijie, L. U. O. (2023). Fault Tolerance for Corporate Innovation: Evidence from the Reform of State-owned Enterprises. Frontiers of Business Research in China, 1.
Sharma, A., Borah, S. B., Haque, T., & Adhikary, A. (2025). Engaging customers and suppliers for environmental sustainability: Investigating the drivers and the effects on firm performance. Journal of the Academy of Marketing Science, 53(2), 341–366.
Shrivastava, P., & Addas, A. (2014). The impact of corporate governance on sustainability performance. Journal of Sustainable Finance & Investment, 4(1), 21–37.
Smith, C., & Fatorachian, H. (2023). COVID-19 and Supply Chain Disruption Management: A Behavioural Economics Perspective and Future Research Direction. Journal of Theoretical and Applied Electronic Commerce Research, 18(4), 2163–2187.
Song, M., Xie, Q., & Shen, Z. (2021). Impact of green credit on high-efficiency utilization of energy in China considering environmental constraints. Energy Policy, 153, 112267.
Steblianskaia, E., Vasiev, M., Denisov, A., Bocharnikov, V., Steblyanskaya, A., & Wang, Q. (2023). Environmental-social-governance concept bibliometric analysis and systematic literature review: Do investors becoming more environmentally conscious? Environmental and Sustainability Indicators, 17, 100230.
Tu, Z., Cao, Y., Goh, M., & Wang, Y. (2024). Executive green cognition and corporate ESG performance. Finance Research Letters, 69, 106271.
Wang, J., Wang, W., Wu, H., & Liu, Y. (2023). Exploring the effects of manufacturing servitization on enterprise energy conservation and emissions reduction moderated by digital transformation. Energy Economics, 122, 106706.
Wang, X., Ma, C., & Yao, Z. (2024). The double-edged sword effect of digital capability on green innovation: Evidence from Chinese listed industrial firms. Economic Analysis and Policy, 82, 321–339.
Wang, X., & Wang, Y. (2021). The impact of environmental governance policy on green innovation: Evidence from China’s quasi-natural experiment. Journal of Financial Research, 10, 134–152.
Wu, H., Mi, J., & Zhang, C. (2024). Does the performance of financial policy improve the total factor productivity in the competition?——Empirical evidence from Chinese listed companies. Finance Research Letters, 59, 104775.
Yang, Y., & Lin, G. T. R. (2025). Local Digital Economic Growth, Enterprise Digital Transformation, and Digital Dividends: Evidence from China. Systems, 13(4), 297.
Yuan, C., Xiao, T., Geng, C., & Sheng, Y. (2021). Digital transformation and division of labor between enterprises: Vertical specialization or vertical integration. China Industrial Economics, 9(1), 137–155.
Zhang, K., & Bu, C. (2024). Top managers with information technology backgrounds and digital transformation: Evidence from small and medium companies. Economic Modelling, 132, 106629.
Zhang, Y., & Yang, F. (2021). Corporate social responsibility disclosure: Responding to investors’ criticism on social media. International Journal of Environmental Research and Public Health, 18(14), 7396.
Zhou, H., & Zhao, S. (2024). Green supply chain integration on firm’s green innovation: The moderating role of resource orchestration capability. Operations Management Research, 17(4), 1380–1396.